Data/Observations/Results
Table of Values
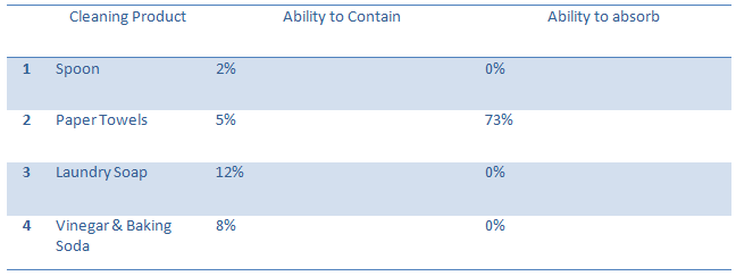
This table shows us what my educated estimate was for the ability of each cleaning product to contain and absorb the oil in the washbasin.
Graph of Table of Values
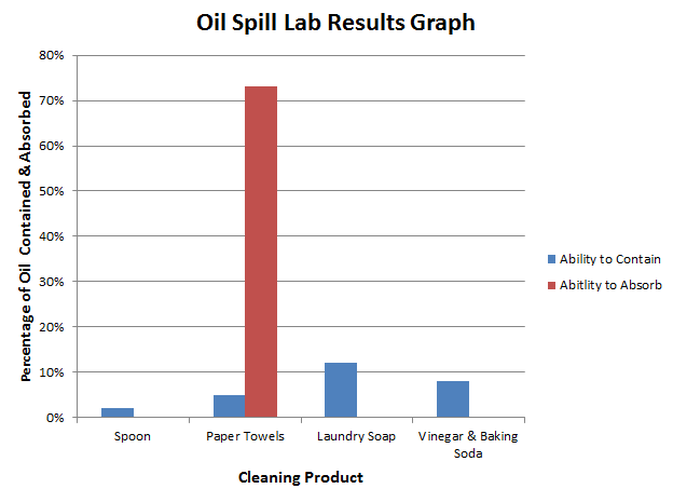
As you can see, this chart is graphing the table of values that is above.
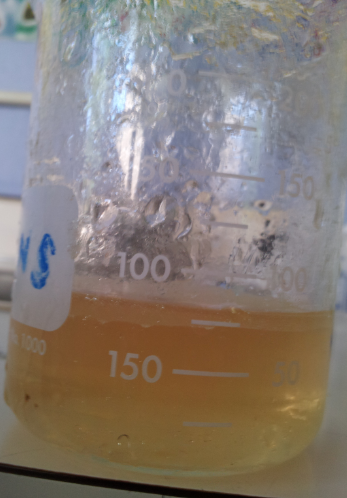
Picture of Measurement of Oil Left After Absorption
Below is the what we recorded of the oil in the beaker. NOTE: There is obviously a mix of water and oil as there was only 50mL of oil to begin with.